
Data & insights
Multi-source metrics and AI insights dashboard
A multi-region reporting workspace that brings analytics, advertising, social and ecommerce data together, with AI analysis on top.
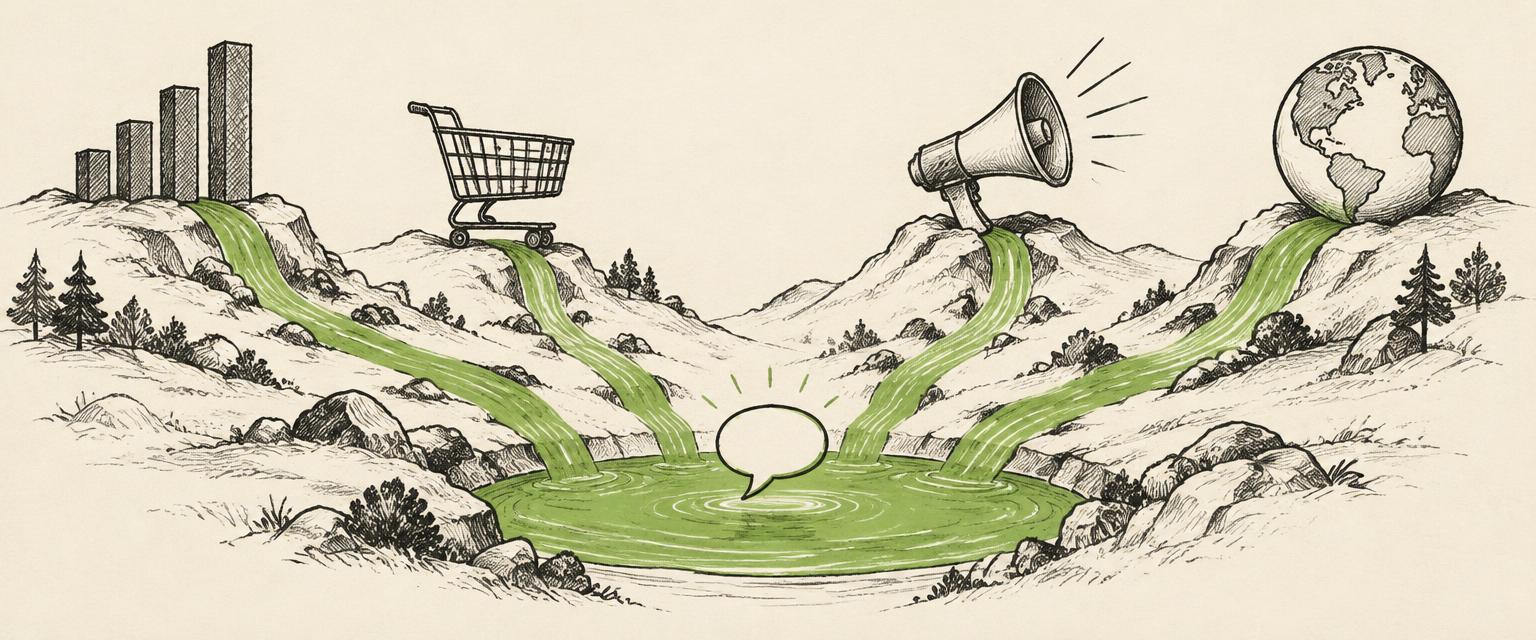
Built for marketing and leadership teams who report across several regions and need one place to see how channels compare, both region by region and combined.
Instead of exporting from each platform into a spreadsheet, the workspace pulls the sources together, keeps regional and combined views a click apart, and lets people ask questions of the data in plain language.
The problem
Reporting was spread across analytics, advertising, social and ecommerce tools, plus manual exports and separate regional dashboards. Building a combined picture took hours each cycle, numbers were hard to compare like for like, and questions raised in meetings often waited until someone could pull the data again.
The solution
A secure, signed-in dashboard connects the sources into one model, with switchable regional and combined views. An AI insights chat, research mode and generated summary reports work from the business's own data, so answers point back to the figures they came from.
The goal
Make regional and combined reporting easier to inspect, compare and discuss.
Turn the page · Entry 49 of 51

Next in the notebook
Voice-first productivity assistant
A conversational assistant for capturing ideas by voice, organizing them into projects and drafting follow-up actions.
Flip to it
Plate · Next step
Bring one real problem. Leave with a clear next step.
Tell Will what you'd like to improve. He'll review your note and suggest a next step. No preparation required.