
Data & insights
Field trip report analytics and dashboard
An automated pipeline extracts and structures field trip reports from SharePoint, feeding regional metrics and customer engagement insights into a centralized dashboard.
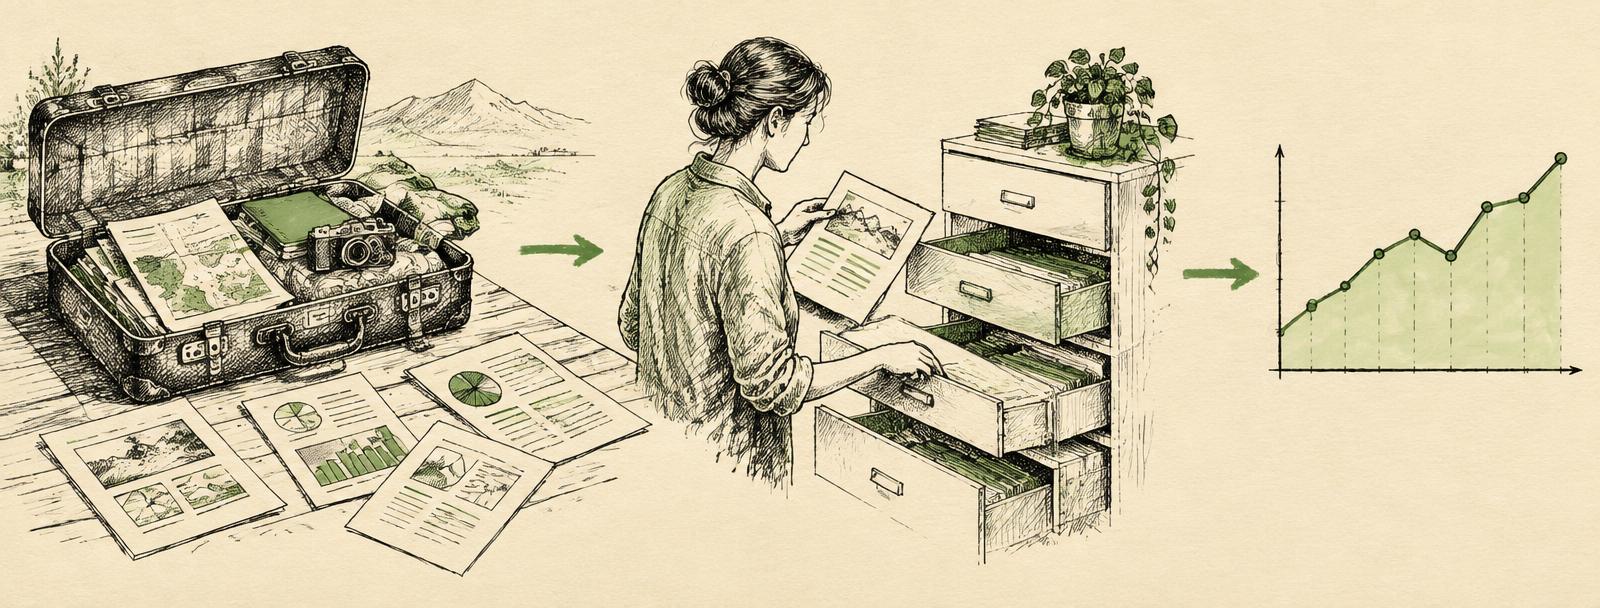
Designed for regional sales teams, operations managers, and executive leadership at an industrial equipment business who need clear visibility into daily customer visits and field activities.
Rather than forcing staff to manually dig through SharePoint folders, the system uses automated processing to read existing reports and transform unstructured notes into searchable metrics, trend overviews, and regional views without changing the rep reporting routine.
The problem
Trip reports submitted by field representatives were scattered across SharePoint folders, requiring repetitive manual effort to gather and analyze. This created blind spots where regional managers struggled to track territory activity and leadership could not easily identify emerging customer needs, recurring themes, or sales opportunities.
The solution
An automated data extraction workflow was built to read and parse trip reports directly from SharePoint without modifying source files. The structured data and extracted highlights were integrated into the existing internal metrics dashboard to deliver filtered regional tables, trend summaries, and high-level activity KPIs.
The goal
Provide cross-functional teams with timely, centralized access to field trip findings and customer engagement trends.
Turn the page · Entry 26 of 51

Next in the notebook
Promotional item and print material portal
A centralized ordering portal that connects sales teams with marketing merchandise and digital assets while syncing inventory movements with the central ERP.
Flip to it
Plate · Next step
Bring one real problem. Leave with a clear next step.
Tell Will what you'd like to improve. He'll review your note and suggest a next step. No preparation required.